EE-Unit-III Eutrophication

What are the sources of nutrients causing eutrophication of lakes and reservoirs? There are many sources. All activities in the entire drainage area of a lake or reservoir are reflected directly or indirectly in the water quality of these water bodies. A lake or reservoir may, however, be naturally eutrophied when situated in a fertile area with naturally nutrient enriched soils. In many lakes and reservoirs wastewater is the main source since untreated wastewater or wastewater treated only by a conventional mechanical- biological methods still contains nitrogen (25-40 mg per liter) and phosphorus (6-10 mg per liter). Both nitrogen and phosphorus can be removed by well-known technology – phosphorus by addition of a chemical that precipitates phosphate though a chemical reaction, and nitrogen usually by biological means through micro- organism activity. Nitrogen costs more money and also, technically speaking, is more difficult to remove than phosphorus.

 General view of a wetland.

Drainage water from agricultural land also contains phosphorus and nitrogen. It usually has much more nitrogen because phosphorus is usually bound to soil components. Extensive use of fertilizers results in significant concentrations of nutrients particularly nitrogen, in agricultural runoff. If eroded soil reaches the lake, both phosphorus and the nitrogen in the soil contribute to eutrophication. Erosion is often caused by deforestation which also results from unwise planning and management of the resource.

Wetlands are increasingly used to solve the problem of diffuse pollution from agriculture which cause eutrophication (Photo 20). Nitrate is converted in wetlands to free nitrogen and released to the air. This is not harmful, as free nitrogen compromises about 4/ 5ths of the atmosphere. Phosphorus is adsorbed by wetland soils and, like nitrogen, is taken up by the plants. Both nitrogen and phosphorus may therefore be removed by wetlands. In addition, it is often also necessary to control fertilizer usage in agricultural practices as the majority may end up in the drainage area, if the diffuse pollution from nutrients is to be reduced sufficiently to improve water quality.

 Aerial view of fish pens in Laguna de Bay, Philippines.

Rain water contains phosphorus and nitrogen from air pollution. As nitrogen is more mobile in the atmosphere than phosphorus, it is usually over 20 times more concentrated than phosphorus. Nitrogen can only be reduced in rain water by extensive controls of the air pollution in the entire region. One can safely say that the main sources of pollution in the atmosphere are from industries and automobile exhaust without proper filtering systems.

When lakes are used for aquaculture, excess fish food pollutes the water as complete use of the food cannot be achieved (Photo 21). Nitrogen and phosphorus present in the excess food is dissolved or suspended in the water. The use of lakes for aquaculture therefore needs careful environmental planning and management practices by the owners and workers.

The sediment of a lake -its muddy bottom layer -contains relatively high concentrations of nitrogen and phosphorus. These can be released to water, particularly under conditions of low oxygen concentrations. The nutrients in the sediment come from the past settling of algae and dead organic matter. The nutrients released from sediments are referred to as the lake’s internal loading.

Figure 5 sketches the sources of nutrients: externally from wastewater, agricultural drainage water, erosion and rain, and internally from activities in the lake itself, e.g. aquaculture and sediment release.

It is possible but very expensive to remove the upper nutrient-rich layer of sediment. Covering sediments with clay to seal them and thereby reduce internal loading has also been tried. Even when nutrients are removed in large amounts from wastewater, agricultural drainage water and rain, it often takes much time before nutrient concentrations fall in the upper sediment layer because they are still present in the water environment. Early reduction or elimination of nutrient sources is therefore very important.

Major sources of nutrients in lakes.

Lakes and reservoirs can be classified according to the extent of their eutrophication (or nutrients enrichment) into four main classes: oligotrophic, mesotrophic, eutrophic and hypereutrophic (Table 3). This classification results from extensive examination of eutrophication in countries within the Organization for Economic Cooperation and Development (OECD) in the 1970s and early 1980s. It is based on concentrations of phosphorus, nitrogen and chlorophyll a (the green plant pigment needed in photosynthesis). Chlorophyll a roughly indicates the concentration of plant biomass (on average 1% of algae biomass is chlorophyll a).

Factors that limit Eutrophication

Table 4 shows the average composition of freshwater plants on a wet basis (when they are not dried): the plants require all listed components in the approximate percentages indicated. Generally, nitrogen (0.7%) and/or phosphorus (0.09%) are usually the first components depleted when plants form following photosynthesis. These two nutrients are less abundant in water than other elements needed, relative to their composition in plants. About eight times more nitrogen is required than phosphorus. Phosphorus thus limits eutrophication if nitrogen is more than eight times as abundant as phosphorus, while nitrogen limits eutrophication if its concentration is less than eight times as abundant as phosphorus.

Growth of blue-green algae on the shore of a lake.

Untreated wastewater and wastewater treated bymechanical-biologicalmethods contain about 32mg/L nitrogen and about 8 mg/L phosphorus on average. In a lake heavily loaded with wastewater, eutrophication is limited by nitrogen, as the nitrogen concentration in the discharged wastewater is only four times the phosphorus concentration. Such lakes often display extensive blooms of blue-green algae as unsightly surface scum (Photo 22). Some species of blue-green algae use nitrogen directly from the air and grow, although dissolved nitrogen is limiting. Lakes that receive natural tributaries and drainage water from agriculture, however, have high nitrogen concentrations and are therefore usually limited by phosphorus.

The central question is not to determine which nutrient is limiting but to determine which nutrient can most easily be made limiting. As phosphorus is more easily and less expensively removed from wastewater than nitrogen, in many cases (but not all) the best environmental management strategy for lakes and reservoirs is to remove as much phosphorus as possible from wastewater.

EE-Unit-III Determination of DO,BOD,COD

What is the Winkler Method?

The Winkler Method is a technique used to measure dissolved oxygen in freshwater systems. Dissolved oxygen is used as an indicator of the health of a water body, where higher dissolved oxygen concentrations are correlated with high productivity and little pollution. This test is performed on-site, as delays between sample collection and testing may result in an alteration in oxygen content.

How does the Winkler Method Work?

The Winkler Method uses titration to determine dissolved oxygen in the water sample. A sample bottle is filled completely with water (no air is left to skew the results). The dissolved oxygen in the sample is then “fixed” by adding a series of reagents that form an acid compound that is then titrated with a neutralizing compound that results in a color change. The point of color change is called the “endpoint,” which coincides with the dissolved oxygen concentration in the sample. Dissolved oxygen analysis is best done in the field, as the sample will be less altered by atmospheric equilibration.

Applications

Dissolved oxygen analysis can be used to determine:

  • the health or cleanliness of a lake or stream,
  • the amount and type of biomass a freshwater system can support,
  • the amount of decomposition occurring in the lake or stream.

How to- Sample Collection, Preparation, Analytical Protocols, and Concerns

Winkler Method for measuring dissolved oxygenshow

Dissolved oxygen should be measured as quickly and carefully as possible. Ideally, samples should be measured in the field immediately after collection.

Reagent List:

  • 2ml Manganese sulfate
  • 2ml alkali-iodide-azide
  • 2ml concentrated sulfuric acid
  • 2ml starch solution
  • Sodium thiosulfate

These reagents are available in dissolved oxygen field kits, such as those made by the Hach Company. Please use caution when using these reagents, as they can be hazardous to one’s health.

Procedure:

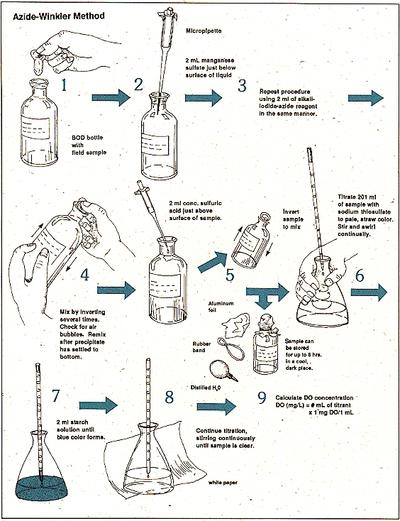
  1. Carefully fill a 300-mL glass Biological Oxygen Demand (BOD) stoppered bottle brim-full with sample water.
  2. Immediately add 2mL of manganese sulfate to the collection bottle by inserting the calibrated pipette just below the surface of the liquid. (If the reagent is added above the sample surface, you will introduce oxygen into the sample.) Squeeze the pipette slowly so no bubbles are introduced via the pipette.
  3. Add 2 mL of alkali-iodide-azide reagent in the same manner.
  4. Stopper the bottle with care to be sure no air is introduced. Mix the sample by inverting several times. Check for air bubbles; discard the sample and start over if any are seen. If oxygen is present, a brownish-orange cloud of precipitate or floc will appear. When this floc has settle to the bottom, mix the sample by turning it upside down several times and let it settle again.
  5. Add 2 mL of concentrated sulfuric acid via a pipette held just above the surface of the sample. Carefully stopper and invert several times to dissolve the floc. At this point, the sample is “fixed” and can be stored for up to 8 hours if kept in a cool, dark place. As an added precaution, squirt distilled water along the stopper, and cap the bottle with aluminum foil and a rubber band during the storage period.
  6. In a glass flask, titrate 201 mL of the sample with sodium thiosulfate to a pale straw color. Titrate by slowly dropping titrant solution from a calibrated pipette into the flask and continually stirring or swirling the sample water.
  7. Add 2 mL of starch solution so a blue color forms.
  8. Continue slowly titrating until the sample turns clear. As this experiment reaches the endpoint, it will take only one drop of the titrant to eliminate the blue color. Be especially careful that each drop is fully mixed into the sample before adding the next. It is sometimes helpful to hold the flask up to a white sheet of paper to check for absence of the blue color.
  9. The concentration of dissolved oxygen in the sample is equivalent to the number of milliliters of titrant used. Each mL of sodium thiosulfate added in steps 6 and 8 equals 1 mg/L dissolved oxygen.

Results Analysis

The total number of milliliters of titrant used in steps 6-8 equals the total dissolved oxygen in the sample in mg/L. Oxygen saturation is temperature dependent – gas is more soluble in cold waters, hence cold waters generally have higher dissolved oxygen concentrations. Dissolved oxygen also depends on salinity and elevation, or partial pressure.

Temperature-Oxygen Saturation Relationship
Biochemical Oxygen Demand

The test for Biochemical Oxygen Demand is especially important in waste water treatment, food manufacturing, and filtration facilities where the concentration of oxygen is crucial to the overall process and end products. High concentrations of dissolved oxygen (DO) predict that oxygen uptake by microorganisms is low along with the required break down of nutrient sources in the medium (sample). On the other hand, low DO readings signify high oxygen demand from microorganisms, and can lead to possible sources of contamination depending on the process.

Performing the test for Biochemical Oxygen Demand requires a significant time commitment for preparation and analysis. The entire process requires five days, and it is not until the last day where data is collected and evaluated. During this time, samples are initially seeded with microorganisms and supplied with a carbon nutrient source of glucose-glutamic acid. The sample is then introduced to an environment suitable for bacterial growth at reproducible temperatures, nutrient sources, and light within a 20 degree Celsius incubator such that oxygen will be consumed. Quality controls, standards and dilutions are also run to test for accuracy and precision. Determination of the dissolved oxygen within the sample can be determined through Winkler titration methods. The difference in initial DO readings (prior to incubation) and final DO readings (after 5 days of incubation) predicts the BOD of the sample. A suitable detection limit as per environmental QC is 1 mg/L.

Chemical Oxygen Demand

In recent times, with the increase of pollution by discharging large amount of various chemicals, oxidisable organic substances of different matter enter in the aquatic system. BOD values alone does not give a clear picture of organic matter contend of the water sample. In addition, the presence of various toxicant in the sample. In addition, the presence of various toxicants in the sample may severely affect the validity of BOD test. Hence chemical oxygen demand (COD) test is a better estimate of organic matter which needs no sophistication and is time saving. However COD that is the oxygen consumed (OC) does not differentiate the stable organic matter from the unstable form, therefore the COD value are not directly comparable to that of BOD.


The amount of organic matter in water is estimated based on their oxidisability by chemical oxidants, such as potassium permanganate or potassium dichromate. For many years, the potassium permanganate was used as oxidizing agent for measuring chemical oxygen demand. But the oxidizing capacity of potassium permanganate varied widely. Nowadays, Potassium dichromate is used instead of potassium permanganate because it is more effective, relatively cheap, easy to purify and is able to oxidize almost all organic compounds.

In this method, a fixed volume of oxidant (here potassium dichromate) is added to the water sample. The organic matter present in the water sample is first oxidized with known volume of potassium dichromate and then excess of oxygen is allowed to react with potassium iodide to liberate iodine in amounts equal to the excess oxygen, which is estimated titrimetrically with sodium thiosulphate as an indicator.


EE-Unit-III Water Contaminants

The Safe Drinking Water Act defines the term “contaminant” as meaning any physical, chemical, biological, or radiological substance or matter in water. Therefore, the law defines “contaminant” very broadly as being anything other than water molecules. Drinking water may reasonably be expected to contain at least small amounts of some contaminants. Some drinking water contaminants may be harmful if consumed at certain levels in drinking water while others may be harmless. The presence of contaminants does not necessarily indicate that the water poses a health risk.

The following are general categories of drinking water contaminants and examples of each:

  • Physical contaminants primarily impact the physical appearance or other physical properties of water. Examples of physical contaminants are sediment or organic material suspended in the water of lakes, rivers and streams from soil erosion.
  • Chemical contaminants are elements or compounds. These contaminants may be naturally occurring or man-made. Examples of chemical contaminants include nitrogen, bleach, salts, pesticides, metals, toxins produced by bacteria, and human or animal drugs.
  • Biological contaminants are organisms in water. They are also referred to as microbes or microbiological contaminants. Examples of biological or microbial contaminants include bacteria, viruses, protozoan, and parasites.
  • Radiological contaminants are chemical elements with an unbalanced number of protons and neutrons resulting in unstable atoms that can emit ionizing radiation. Examples of radiological contaminants include cesium, plutonium and uranium.

EE-Unit-III Water pollution

Water pollution is the contamination of natural water bodies by chemical, physical, radioactive or pathogenic microbial substances. Adverse alteration of water quality presently produces large scale illness and deaths, accounting for approximately 50 million deaths per year worldwide, most of these deaths occurring in Africa and Asia. In China, for example, about 75 percent of the population (or 1.1 billion people) are without access to unpolluted drinking water, according to China’s own standards.[1]Widespread consequences of water pollution upon ecosystems include species mortality, biodiversityreduction and loss of ecosystem services. Some consider that water pollution may occur from natural causes such as sedimentation from severe rainfall events; however, natural causes, including volcanic eruptions and algae blooms from natural causes constitute a minute amount of the instances of world water pollution. The most problematic of water pollutants are microbes that induce disease, since their sources may be construed as natural, but a preponderance of these instances result from human intervention in the environment or human overpopulation phenomena.

Classes of water pollutants

Chemical water pollutants are generally atoms or molecules, which have been discharged into natural water bodies, usually by activities of humans. Common examples of such chemical water pollutants are mercury emanating from mining activity, certain nitrogen compounds used in agriculturechlorinated organic molecules arising from sewage or water treatment plants [2] or various acids which are the externalities of various manufacturing activities.

Physical water pollutants are either (a) much larger particles or (b) physical factors such as temperature change, both of which while not typically toxic, cause a variety of harmful effects. The most obvious of physical pollutants are (a) excessive sediment load, mostly arising from over-intense land use practices and (b) rubbish discarded from human manufacturing activity (e.g. plastic bags, bottles). While these materials are not so harmful to human health as chemicals or pathogens, they comprise the majority of visual impact of water pollution. In the case of thermal pollution, these point source discharges typically affect the metabolism of aquatic fauna in adverse ways.

Radioactive substances are really merely a special sub-class of chemical pollutants, and by mass represent the smallest of the contributors to water pollution; however, their potential for harm allows recognition as a separate class. In fact, most discharge of radioactivity is not from the negligible escape from nuclear power plants, but rather arises from agricultural practices such as tobacco farming, where radioactive contamination of phosphate fertilizer is a common method of introduction of radioactive materials into the environment.

Common pathogenic microbes introduced into natural water bodies are pathogens from untreated sewage or surface runoff from intensive livestock grazing. One of the most common disease agents is Giardia lamblia, a parasitic protozoan common in fecal material of many fauna including humans; this microbe is particularly insidious, due to its resistance to conventional sewage treatment. This and other protozoans and bacteria are important causes of illness and mortality in developing countries where population density, water scarcity and inadequate sewage treatment combine to occasion widespread parasitic and bacterial disease.

Sources

Water pollutant sources can be grouped into two super categories: (a) point sources which can be attributed to discrete discharge from a factory or sewage outfall and (b) non-point sources that include agricultural runoff, urban storm water runoff and other area wide sources.

Many of the common inorganic chemical water pollutants are produced by non-point sources, chiefly relating to intensive agriculture and high-density urban areas. Specific inorganic chemicals and their major sources are: monopotassium phosphate, ammonium nitrate and a host of related phosphate and nitrogen compounds used in agricultural fertilizers; heavy metals (present in urban runoff and mine tailings area runoff). However, some inorganics such as chlorine and related derivatives are produced chiefly from point sources, ironically employed in water treatment facilities. Moreover, some of the large dischargers of heavy metals to aquatic media are fixed point industrial plants.

Improper storage and use of automotive fluids produce common organic chemicals causing water pollution are: methanol and ethanol (present in wiper flluid); gasoline and oil compounds such as octane, nonane (overfilling of gasoline tanks); most of these foregoing discharges are considered non-point sources since their pathway to watercourses is mainly overland flow. However, leaking underground and above ground storage tanks can be considered point sources for some of these same chemicals, and even more toxic organics such as perchloroethylene. Grease and fats (higher chain length carbon molecules such as present in auto lubrication and restaurant effluent can be either point or non-point sources depending upon whether the restaurant releases grease into the wastewater collection system (point source) or disposes of such organics on the exterior ground surface or transports to large landfills, both of which last two cases lead to non-point release to water systems.

The most significant physical pollutant is excess sediment in runoff from agricultural plots, clearcut forests, improperly graded slopes, urban streets and other poorly managed lands, especially when steep slopes or lands near streams are involved. Other physical pollutants include a variety of plastic refuse products such as packaging materials; the most pernicious of these items are ring shaped objects that can trap or strangle fish and other aquatic fauna. Other common physical objects are timber slash debris, waste paper and cardboard. Finally power plants and other industrial facilities that use natural water bodies for cooling are the main sources of thermal pollution.

Common pathogenic microbes, in addition to G. lamblia, are: species of the genus Salmonella (which variously cause typhoid fever and food-borne illnesses); species in the genus Cryptosporidium, which are fecal-oral route parasites often transmitted as water pollutants and are associated with inadequate sanitation; parasitic worms that live inside faunal digestive systems for part of their life cycle (This widespread syndrome is spread partially as water pollutants, with an estimated three billion people currently affected). Hepatitis A is a viral disease, one of whose pathways of transmission is water-borne.

Historic trends

captionAerial view of riverine sediment loads in Madagascar including plume influx to the Indian Ocean. Source: NASA. 2000

While it is not possible to reconstruct water pollution conditions throughout prehistory, certain facts are clear. Modern prevalence of chemical and radioactive water pollutants are clearly correlated with the population explosion and resource use of modern humans. The trends in chemical water pollution increasing from the early Holocene to the 1960s is relatively clear worldwide; starting with the advent of the Australia in the USA, a turnaround in most aspects of water quality began in the early 1970s for most of North America; similar trends in much of Europe as well as India and Madagascar began slightly later. Only in the developing countries including China and rainforest, has chemical water pollution failed to reach a peak, due to high population growth coupled with the priority of economic development above environmental protection in many cases.

Sediment loading of surface waters is a clear long term increasing problem, due to the intensification of agriculture (both for crops and livestock) and increased runoff from urbanization. In extreme cases, such as the north central highlands of coral reef massive topsoil loss has followed extreme slash-and-burn Holocene destruction from the 1970s onward. Most of this loss has resulted in ongoing heavy sediment loads to the central Madagascar river system as well as many of the nearby coastal waters in the Indian Ocean.

A more interesting situation arises with pathogenic microbes. Even though there is evidence that many of the present day water-borne microbes existed earlier in the Quaternary for humans[3] and even as early asCretaceous Period times for other fauna,[4] a case may be made that the rate of incidence of microbial pathogenic infection may be at an all time high for humans, given the overcrowding and inability to supply fresh drinking water to a large percentage of the human population in its present level of 2010. These effects are exacerbated by the likelihood that modern diseases may be mutating at a more rapid rate than historic, given the abrupt man-induced alterations of the chemical, physical and biological environment; human adaptation is not likely to be able to keep up with the pace of such disease mutation velocities; therefore, it is likely that present day water-borne pathogenic disease is at a higher rate of occurrence with present day human populations, in all world regions except for those where water pollution control, medical care and prevention are at the highest levels (e.g. USA, New Zealand, Australia, Sweden, Denmark).

Water pollution control

Non-point source control relates chiefly to land management practices in the fields of agriculture, silviculture, mining and urban design and sanitation. Agricultural practices leading to the greatest improvement of sediment control include: contour grading, avoidance of bare soils in rainy and windy seasons, polyculture farming resulting in greater vegetative cover, and increasing fallow periods. Minimization of fertilizer, pesticide and herbicide runoff is best accomplished by reducing the quantities of these materials, as well as using application times removed from periods of high precipitation. Other techniques include avoidance of highly water soluble pesticide and herbicide compounds, and use of materials that have the most rapid decay times to benign substances.

The chief water pollutants associated with mines and quarries are aqueous slurries of minute rock particles, which result from rainfall scouring exposed soils and haul roads and also from rock washing and grading activities. Runoff from metal mines and ore recovery plants is typically contaminated by the minerals present in the native rock formations. Control of this runoff is chiefly derived by controlling rapid runoff and designing mining operations to avoid tailings either on steep slopes or near streams.

In the case of urban stormwater control, the most important methods are achieved in urban planning by use of minimal net surface runoff of impermeable surfaces. This is not merely a simply geometric design issue of avoiding sprawl and minimizing paved surfaces, but also a strategy of incorporating holding ponds into landscaping and use of bioswales and permeable pavers. At an operational level, the use of native plant and xeriscape techniques reduces water use and water runoff and also minimizes need for pesticides and nutrients. In regard to street maintenance, a periodic use of streetsweeping can reduce the sediment, chemical and rubbish load into the storm sewer system.

captionDifferent examples of water pollution. ​A, C & F. Eutrophication in water bodies due to dumping of agricultural wastes and fertilizers. ​​B & D. Undesirable growth of aquatic plants and algae on water canals clogging water flow and contaminating water. E. Algal mat collected on dried polluted water body. G. Accumulation of heavy organic wastes on standing water bodies. 

EE-Unit-II Ambient Air Quality Standards

National Ambient Air Quality Standards, as of 2009
Pollutant Time Weighted Average Concentration in Ambient Air
Industrial, Residential, Rural and Other Area Ecologically Sensitive Area (notified by Central Government) Methods of Measurement
SO2, μg/m3 Annual* 50 20
  • Improved West and Gaeke
  • Ultraviolet fluorescence
24 hours** 80 80
NO2, μg/m3 Annual* 40 30
  • Modified Jacob & Hochheiser (Na-Arsenite)
  • Chemiluminescence
24 hours** 80 80
PM10, μg/m3 Annual* 60 60
  • Gravimetric
  • TOEM
  • Beta attenuation
24 hours** 100 100
PM2.5, μg/m3 Annual* 40 40
  • Gravimetric
  • TOEM
  • Beta attenuation
24 hours** 60 60
O3, μg/m3 8 hours** 100 100
  • UV photometric
  • Chemiluminescence
  • Chemical Method
1 hour** 180 180
Lead (Pb), μg/m3 Annual* 0.50 0.50
  • AAS/ICP method after sampling on EMP 2000 or equivalent filter paper
  • ED-XRF using Teflon filter
24 hours** 1 1
CO, mg/m3 8 hours** 2 2
  • Non Dispersive Infra Red (NDIR) spectrosopy
1 hour** 4 4
Ammonia (NH3) μg/m3 Annual* 100 100
  • Chemiluminescence
  • Indophenol blue method
24 hours** 400 400
Benzene Annual* 5 5
  • Gas chromatography based on continuous analyzer
  • Adsorption and Desorption followed by GC analysis
Benzopyrene (BaP) – particulate phase only, ng/m3 Annual* 1 1
  • Solvent extraction followed by HPLC/GC analysis
Arsenic (As), ng/m3 Annual* 6 6
  • AAS/ICP method after sampling on EMP 2000 or equivalent filter paper
Nickel (Ni), ng/m3 Annual* 20 20
  • AAS/ICP method after sampling on EMP 2000 or equivalent filter paper
* Annual arithmetic mean of minimum 104 measurements in a year at a particular site taken twice a week 24 hourly at uniform intervals.

** 24 hourly or 8 hourly or 1 hourly monitored values, as applicable, shall be compiled with 98% of the time in a year. 2% of the time, theymay exceed the limits but not on two consecutive days of monitoring.


3.2 Monitoring

The National Air Monitoring Programme (NAMP) is a nation-wide program headed by the Central Pollution Control Board whose purpose is to monitor levels of key air pollutants, report violations, and conduct research on pollution trends. NAMP monitors levels of SO2, NO2, Suspended Particulate Matter (SPM), and Respirable Suspended Particulate Matter (RSPM / PM10) at 342 operating stations in 127 cities across India.

EE-Unit-II Air pollution Control

  • Air quality management sets the tools to control air pollutant emissions.
  • Control measurements describes the equipment, processes or actions used to reduce air pollution.
  • The extent of pollution reduction varies among technologies and measures.
  • The selection of control technologies depends on environmental, engineering, economic factors and pollutant type.

Settling Chambers

  • Settling chambers use the force of gravity to remove solid particles.
  • The gas stream enters a chamber where the velocity of the gas is reduced. Large particles drop out of the gas and are recollected in hoppers. Because settling chambers are effective in removing only larger particles, they are used in conjunction with a more efficient control device.
    Figure: Settling chambers

Cyclones

  • The general principle of inertia separation is that the particulate-laden gas is forced to change direction. As gas changes direction, the inertia of the particles causes them to continue in the original direction and be separated from the gas stream.
  • The walls of the cyclone narrow toward the bottom of the unit, allowing the particles to be collected in a hopper.
  • The cleaner air leaves the cyclone through the top of the chamber, flowing upward in a spiral vortex, formed within a downward moving spiral.

    Cyclones are efficient in removing large particles but are not as efficient with smaller particles. For this reason, they are used with other particulate control devices.

Venturi Scrubbers

  • Venturi scrubbers use a liquid stream to remove solid particles.
  • In the venturi scrubber, gas laden with particulate matter passes through a short tube with flared ends and a constricted middle.
  • This constriction causes the gas stream to speed up when the pressure is increased.
  • The difference in velocity and pressure resulting from the constriction causes the particles and water to mix and combine.
  • The reduced velocity at the expanded section of the throat allows the droplets of water containing the particles to drop out of the gas stream.
  • Venturi scrubbers are effective in removing small particles, with removal efficiencies of up to 99 percent.
  • One drawback of this device, however, is the production of wastewater.
  • Fabric filters, or baghouses, remove dust from a gas stream by passing the stream through a porous fabric. The fabric filter is efficient at removing fine particles and can exceed efficiencies of 99 percent in most applications.
  • The selection of the fiber material and fabric construction is important to baghouse performance.
  • The fiber material from which the fabric is made must have adequate strength characteristics at the maximum gas temperature expected and adequate chemical compatibility with both the gas and the collected dust.
  • One disadvantage of the fabric filter is that high-temperature gases often have to be cooled before contacting the filter medium.

Figure: Fabric filter (baghouse) components


Electrostatic Precipitators (ESPs)

  • An ESP is a particle control device that uses electrical forces to move the particles out of the flowing gas stream and onto collector plates.
  • The ESP places electrical charges on the particles, causing them to be attracted to oppositely charged metal plates located in the precipitator.
  • The particles are removed from the plates by “rapping” and collected in a hopper located below the unit.
  • The removal efficiencies for ESPs are highly variable; however, for very small particles alone, the removal efficiency is about 99 percent.
  • Electrostatic precipitators are not only used in utility applications but also other industries (for other exhaust gas particles) such as cement (dust), pulp & paper (salt cake & lime dust), petrochemicals (sulfuric acid mist), and steel (dust & fumes).


Figure: Electrostatic precipitator components


Control of gaseous pollutants from stationary sources

  • The most common method for controlling gaseous pollutants is the addition of add-on control devices to recover or destroy a pollutant.
  • There are four commonly used control technologies for gaseous pollutants:
    – Absorption,
    – Adsorption,
    – Condensation, and
    – Incineration (combustion)

Absorption


  • The removal of one or more selected components from a gas mixture by absorption is probably the most important operation in the control of gaseous pollutant emissions.
  • Absorption is a process in which a gaseous pollutant is dissolved in a liquid.
  • As the gas stream passes through the liquid, the liquid absorbs the gas, in much the same way that sugar is absorbed in a glass of water when stirred.
  • Absorbers are often referred to as scrubbers, and there are various types of absorption equipment.
  • The principal types of gas absorption equipment include spray towers, packed columns, spray chambers, and venture scrubbers.
  • In general, absorbers can achieve removal efficiencies grater than 95 percent. One potential problem with absorption is the generation of waste-water, which converts an air pollution problem to a water pollution problem.

Adsorption

  • When a gas or vapor is brought into contact with a solid, part of it is taken up by the solid. The molecules that disappear from the gas either enter the inside of the solid, or remain on the outside attached to the surface. The former phenomenon is termed absorption (or dissolution) and the latter adsorption.
  • The most common industrial adsorbents are activated carbon, silica gel, and alumina, because they have enormous surface areas per unit weight.
  • Activated carbon is the universal standard for purification and removal of trace organic contaminants from liquid and vapor streams.
    Carbon adsorption systems are either regenerative or non-regenerative.
    – Regenerative system usually contains more than one carbon bed. As one bed actively removes pollutants, another bed is being regenerated for future use.
    – Non-regenerative systems have thinner beds of activated carbon. In a non-regenerative adsorber, the spent carbon is disposed of when it becomes saturated with the pollutant.


Condensation

  • Condensation is the process of converting a gas or vapor to liquid. Any gas can be reduced to a liquid by lowering its temperature and/or increasing its pressure.
  • Condensers are typically used as pretreatment devices. They can be used ahead of absorbers, absorbers, and incinerators to reduce the total gas volume to be treated by more expensive control equipment. Condensers used for pollution control are contact condensers and surface condensers.
  • In a contact condenser, the gas comes into contact with cold liquid.
  • In a surface condenser, the gas contacts a cooled surface in which cooled liquid or gas is circulated, such as the outside of the tube.
  • Removal efficiencies of condensers typically range from 50 percent to more than 95 percent, depending on design and applications.

Incineration

  • Incineration, also known as combustion, is most used to control the emissions of organic compounds from process industries.
  • This control technique refers to the rapid oxidation of a substance through the combination of oxygen with a combustible material in the presence of heat.
    When combustion is complete, the gaseous stream is converted to carbon dioxide and water vapor.
  • Equipment used to control waste gases by combustion can be divided in three categories:
    – Direct combustion or flaring,
    – Thermal incineration and
    – Catalytic incineration.

Direct combustor

  • Direct combustor is a device in which air and all the combustible waste gases react at the burner. Complete combustion must occur instantaneously since there is no residence chamber.
  • A flare can be used to control almost any emission stream containing volatile organic compounds. Studies conducted by EPA have shown that the destruction efficiency of a flare is about 98 percent.
    In thermal incinerators the combustible waste gases pass over or around a burner flame into a residence chamber where oxidation of the waste gases is completed. Thermal incinerators can destroy gaseous pollutants at efficiencies of greater than 99 percent when operated correctly.


    Thermal incinerator general case

    Catalytic incinerators are very similar to thermal incinerators. The main difference is that after passing through the flame area, the gases pass over a catalyst bed. A catalyst promotes oxidation at lower temperatures, thereby reducing fuel costs. Destruction efficiencies greater than 95 percent are possible using a catalytic incinerator.


    Catalytic incinerator

EE-Unit-II Temperature Inversion

There are several aspects of stable air conditions that should be understood by the firefighter. One is the relationship of surface inversions to thermal belts. In the graphic below, we again illustrate the nighttime drainage of cool air into a valley. Air in contact with the upper slopes cools and flows downslope like water, always seeking the lowest elevation. This drainage is most prominent in side canyons and draws.

Nightime cooling
Nightime cooling creates stable air

Depending on the size of the valley, the pooling of cool air may be several hundred feet deep. An inversion develops above the pool of cool air. Remember, an inversion is a layer of air in which the temperature increases with increase in altitude.

Inversion : A layer of air in which the temperature increases with increase in altitude.

Inversion example Inversion and thermal belts
Example of an inversion Inversion and thermal belt relationship

Where the inversion layer contacts the mountain slopes, we have a relatively warm area called the thermal belt. (See above graphic) At night, the temperature in this region is actually warmer than on the slopes above or below. The elevation of the thermal belt varies by locality and depends on the time of night and the size of the valley below. Its depth also varies.

Thermal belts can, and often do, have a significant effect on fire control efforts. To the firefighter, the thermal belt is an area on a mountainous slope that typically experiences the least variation in diurnal temperature, has the highest average temperature, and has the lowest average relative humidity. Overall, this area can have the highest average fire danger. Most important is the continued active burning during the night, while areas above and below the thermal belt are relatively quiet.

Thermal Belt : An area on a mountain slope that typically experiences the least variation in diurnal temperature, has the highest average temperatures, and the lowest average relative humidity.

Fire behavior can remain extreme at night in thermal belts

Subsidence

Subsidence : A slow, sinking motion of high level air over a broad area occurring in high pressure areas. The subsiding air is warmed by compression and becomes more stable.

Effects of subsidence

Subsidence is a slow process that occurs over a period of several days. During summer and autumn, somewhat stationary, deep high-pressure cells often develop over relatively large areas of the land.

If the high-pressure system persists for a period of days, a subsidence inversion aloft slowly lowers toward the surface. The cold, dry air at very high altitudes, which is lowering, becomes warmer and drier as it reaches lower altitudes. The tops of mountain ranges will experience the warm, very dry air first. If this condition persists, fuels are dried out and burning conditions become severe.

Foehn winds
Foehn winds caused by areas of subsidence

Another important effect of subsidence can be foehn winds. (See figure above) Foehn winds often occur on the lee slopes of prominent mountain ranges when the windward sides of the mountains are exposed to areas of subsidence. Heavy, stable air within the high-pressure cell pushes out in all directions from the center of the high but is restricted in its horizontal movement by the presence of the mountains. Eventually, this heavy air pours over the ridges and through canyons, creating strong, warm, dry winds at lower elevations on the lee side of the mountains

EE-Unit-II Ozone Layer Depletion


Ozone layer is a deep layer in earth’s atmosphere that contain ozone which is a naturally occurring molecule containing three oxygen atoms. These ozone molecules form a gaseous layer in the Earth’s upper atmosphere called stratosphere. This lower region of stratosphere containing relatively higher concentration of ozone is called Ozonosphere. The ozonosphere is found 15-35 km (9 to 22 miles) above the surface of the earth. The average concentration of ozone in the atmosphere is around 0.6 parts per million. The thickness of the ozone layer differs as per season and geography. The highest concentrations of ozone occur at altitudes from 26 to 28 km (16 to 17 miles) in the tropics and from 12 to 20 km (7 to 12 miles) towards the poles.

The ozone layer forms a thick layer in stratosphere, encircling the earth, that has large amount of ozone in it. It protects our planet i.e. Earth from the harmful radiations that comes from the sun. The ozone layer was discovered in 1913 by the French physicists Charles Fabry and Henri Buisson. The ozone layer has the capability to absorb almost 97-99% of the harmful ultraviolet radiations that sun emit and which can produce long term devastating effects on humans beings as well as plants and animals.

Ozone_hole

Why Ozone Layer is Necessary?

An essential property of ozone molecule is its ability to block solar radiations of wavelengths less than 290 nanometers from reaching Earth’s surface. In this process, it also absorbs ultraviolet radiations that are dangerous for most living beings. UV radiation could injure or kill life on Earth. Though the absorption of UV radiations warms the stratosphere but it is important for life to flourish on planet Earth. Research scientists have anticipated disruption of susceptible terrestrial and aquatic ecosystems due to depletion of ozone layer.

Ultraviolet radiation could destroy the organic matter. Plants and plankton cannot thrive, both acts as food for land and sea animals, respectively. For humans, excessive exposure to ultraviolet radiation leads to higher risks of cancer (especially skin cancer) and cataracts. It is calculated that every 1 percent decrease in ozone layer results in a 2-5 percent increase in the occurrence of skin cancer. Other ill-effects of the reduction of protective ozone layer include – increase in the incidence of cataracts, sunburns and suppression of the immune system.

Causes of Ozone Layer Depletion

During the last several decades, human activities have resulted in considerable reduction in the ozone layer of the atmosphere. Ozone depletion occurs when destruction of the stratospheric ozone is more than the production of the molecule. The scientists have observed reduction in stratospheric ozone since early 1970s. It is found to be more prominent in Polar Regions.

There are two regions in which the ozone layer has depleted.

  • In the mid-latitude, for example, over Australia, ozone layer is thinned. This has led to an increase in the UV radiation reaching the earth. It is estimated that about 5-9% thickness of the ozone layer has decreased, increasing the risk of humans to over-exposure to UV radiation owing to outdoor lifestyle.
  • In atmospheric regions over Antarctica, ozone layer is significantly thinned, especially in spring season. This has led to the formation of what is called ‘ozone hole’. Ozone holes refer to the regions of severely reduced ozone layers. Usually ozone holes form over the Poles during the onset of spring seasons. One of the largest such hole appears annually over Antarctica between September and November.

Ozone_layer_depletion

Natural causes of depletion of ozone layer: Ozone layer has been found to be affected by certain natural phenomena such as Sun-spots and stratospheric winds. But this has been found to cause not more than 1-2% depletion of the ozone layer and the effects are also thought to be only temporary. It is also believed that  the major volcanic eruptions (mainly El Chichon in 1983 and and Mt. Pinatubo in 1991) has also contributed towards ozone depletion.

Man-made causes of depletion of ozone layer: The main cause for the depletion of ozone is determined as excessive release of chlorine and bromine from man-made compounds such as chlorofluorocarbons (CFCs). CFCs (chlorofluorocarbons), halons, CH3CCl3 (Methyl chloroform), CCl4 (Carbon tetrachloride), HCFCs (hydro-chlorofluorocarbons), hydrobromofluorocarbons and methyl bromide are found to have direct impact on the depletion of the ozone layer. These are categorized as ozone-depleting substances (ODS). Chlorofluorocarbons are released into the atmosphere due to:

  • Cleaning Agents
  • Coolants in refrigerators
  • Packing material
  • Air conditioning
  • Aerosol spray cans etc.

The problem with the Ozone-Depleting Substances (ODS) is that they are not washed back in the form of rain on the earth and in-fact remain in the atmosphere for quite a long time. With so much stability, they are transported into the stratosphere. The emission of ODS account for roughly 90% of total depletion of ozone layer in stratosphere. These gases are carried to the stratosphere layer of atmosphere where ultraviolet radiations from the sun break them to release chlorine (from CFCs) and bromine (from methyl bromide and halons). The chlorine and bromine free radicals react with ozone molecule and destroy their molecular structure, thus depleting the ozone layer. One chlorine atom can break more than 1, 00,000 molecules of ozone. Bromine atom is believed to be 40 times more destructive than chlorine molecules.

Main Ozone Depleting Substances (OCD)

  • Chlorofluorocarbons: Account for more than 80% of ozone depletion. Used in freezers, air cooling component, dry-cleaning agents, hospital sterilants.
  • Methyl Chloroform: Used for vapour degreasing, some aerosols, cold cleaning, adhesives and chemical processing.
  • Hydrochlorofluorocarbons: Substitutes for CFC’s but still play a vital role in ozone depletion.
  • Halons
  • Carbon Tetrachloride: Mainly used in fire extinguishers

EE-Unit-II Green House Effect

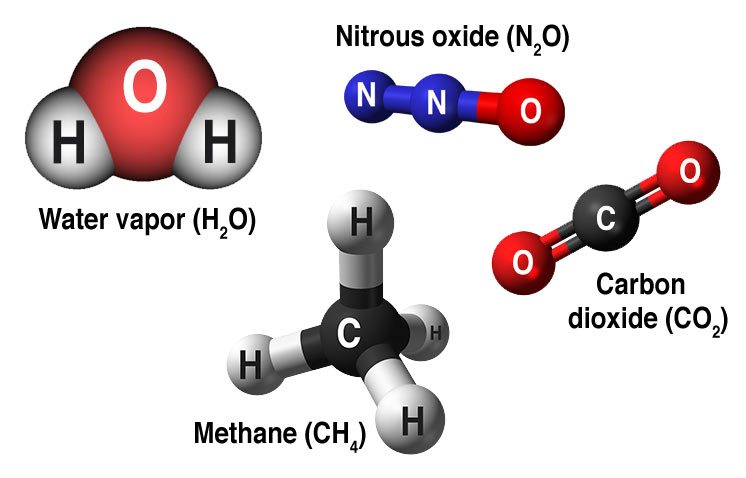
A layer of greenhouse gases – primarily water vapor, and including much smaller amounts
of carbon dioxide, methane and nitrous oxide – acts as a thermal blanket for the Earth, absorbing heat and warming the surface to a life-supporting average of 59 degrees Fahrenheit (15 degrees Celsius).
A layer of greenhouse gases – primarily water vapor, and including much smaller amounts of carbon dioxide, methane and nitrous oxide – acts as a thermal blanket for the Earth, absorbing heat and warming the surface to a life-supporting average of 59 degrees Fahrenheit (15 degrees Celsius).

Most climate scientists agree the main cause of the current global warming trend is human expansion of the “greenhouse effect”1 — warming that results when the atmosphere traps heat radiating from Earth toward space.

Certain gases in the atmosphere block heat from escaping. Long-lived gases that remain semi-permanently in the atmosphere and do not respond physically or chemically to changes in temperature are described as “forcing” climate change. Gases, such as water vapor, which respond physically or chemically to changes in temperature are seen as “feedbacks.”

Gases that contribute to the greenhouse effect include:

Link
  • Water vapor. The most abundant greenhouse gas, but importantly, it acts as a feedback to the climate. Water vapor increases as the Earth’s atmosphere warms, but so does the possibility of clouds and precipitation, making these some of the most important feedback mechanisms to the greenhouse effect.
  • Carbon dioxide (CO2). A minor but very important component of the atmosphere, carbon dioxide is released through natural processes such as respiration and volcano eruptions and through human activities such as deforestation, land use changes, and burning fossil fuels. Humans have increased atmospheric CO2 concentration by a third since the Industrial Revolution began. This is the most important long-lived “forcing” of climate change.
  • Methane. A hydrocarbon gas produced both through natural sources and human activities, including the decomposition of wastes in landfills, agriculture, and especially rice cultivation, as well as ruminant digestion and manure management associated with domestic livestock. On a molecule-for-molecule basis, methane is a far more active greenhouse gas than carbon dioxide, but also one which is much less abundant in the atmosphere.
  • Nitrous oxide. A powerful greenhouse gas produced by soil cultivation practices, especially the use of commercial and organic fertilizers, fossil fuel combustion, nitric acid production, and biomass burning.
  • Chlorofluorocarbons (CFCs). Synthetic compounds entirely of industrial origin used in a number of applications, but now largely regulated in production and release to the atmosphere by international agreement for their ability to contribute to destruction of the ozone layer. They are also greenhouse gases.
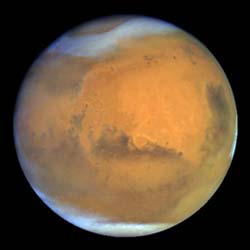
Not enough greenhouse effect: The planet Mars has a very thin atmosphere, nearly all carbon dioxide.   Because of the low atmospheric pressure, and with little to no methane or water vapor to reinforce the weak greenhouse effect, Mars has a largely frozen surface that shows no evidence of life.
Not enough greenhouse effect: The planet Mars has a very thin atmosphere, nearly all carbon dioxide. Because of the low atmospheric pressure, and with little to no methane or water vapor to reinforce the weak greenhouse effect, Mars has a largely frozen surface that shows no evidence of life.
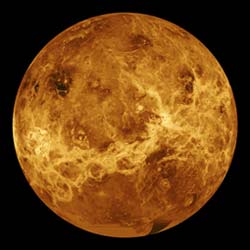
Too much greenhouse effect: The atmosphere of Venus, like Mars, is nearly all carbon dioxide.  But Venus has about 300 times as much carbon dioxide in its atmosphere as Earth and Mars do, producing a runaway greenhouse effect and a surface temperature hot enough to melt lead.
Too much greenhouse effect: The atmosphere of Venus, like Mars, is nearly all carbon dioxide. But Venus has about 300 times as much carbon dioxide in its atmosphere as Earth and Mars do, producing a runaway greenhouse effect and a surface temperature hot enough to melt lead.

On Earth, human activities are changing the natural greenhouse. Over the last century the burning of fossil fuels like coal and oil has increased the concentration of atmospheric carbon dioxide (CO2). This happens because the coal or oil burning process combines carbon with oxygen in the air to make CO2. To a lesser extent, the clearing of land for agriculture, industry, and other human activities have increased concentrations of greenhouse gases.

The consequences of changing the natural atmospheric greenhouse are difficult to predict, but certain effects seem likely:

  • On average, Earth will become warmer. Some regions may welcome warmer temperatures, but others may not.
  • Warmer conditions will probably lead to more evaporation and precipitation overall, but individual regions will vary, some becoming wetter and others dryer.
  • A stronger greenhouse effect will warm the oceans and partially melt glaciers and other ice, increasing sea level. Ocean water also will expand if it warms, contributing further to sea level rise.
  • Meanwhile, some crops and other plants may respond favorably to increased atmospheric CO2, growing more vigorously and using water more efficiently. At the same time, higher temperatures and shifting climate patterns may change the areas where crops grow best and affect the makeup of natural plant communities.

The role of human activity

In its Fourth Assessment Report, the Intergovernmental Panel on Climate Change, a group of 1,300 independent scientific experts from countries all over the world under the auspices of the United Nations, concluded there’s a more than 90 percent probability that human activities over the past 250 years have warmed our planet.

The industrial activities that our modern civilization depends upon have raised atmospheric carbon dioxide levels from 280 parts per million to 400 parts per million in the last 150 years. The panel also concluded there’s a better than 90 percent probability that human-produced greenhouse gases such as carbon dioxide, methane and nitrous oxide have caused much of the observed increase in Earth’s temperatures over the past 50 years.

They said the rate of increase in global warming due to these gases is very likely to be unprecedented within the past 10,000 years or more.

Solar irradiance

It’s reasonable to assume that changes in the sun’s energy output would cause the climate to change, since the sun is the fundamental source of energy that drives our climate system.

Indeed, studies show that solar variability has played a role in past climate changes. For example, a decrease in solar activity is thought to have triggered the Little Ice Age between approximately 1650 and 1850, when Greenland was largely cut off by ice from 1410 to the 1720s and glaciers advanced in the Alps.

But several lines of evidence show that current global warming cannot be explained by changes in energy from the sun:

  • Since 1750, the average amount of energy coming from the sun either remained constant or increased slightly.
  • If the warming were caused by a more active sun, then scientists would expect to see warmer temperatures in all layers of the atmosphere. Instead, they have observed a cooling in the upper atmosphere, and a warming at the surface and in the lower parts of the atmosphere. That’s because greenhouse gasses are trapping heat in the lower atmosphere.
  • Climate models that include solar irradiance changes can’t reproduce the observed temperature trend over the past century or more without including a rise in greenhouse gases.

EE-Unit-II Photochemical Smog

The industrial revolution has been the central cause for the increase in pollutants in the atmosphere over the last three centuries. Before 1950, the majority of this pollution was created from the burning of coal for energy generation, space heating, cooking, and transportation. Under the right conditions, the smoke and sulfur dioxide produced from the burning of coal can combine with fog to create industrial smog. In high concentrations, industrial smog can be extremely toxic to humans and other living organisms. London is world famous for its episodes of industrial smog. The most famous London smog event occurred in December, 1952 when five days of calm foggy weather created a toxic atmosphere that claimed about 4000 human lives. Today, the use of other fossil fuels, nuclear power, and hydroelectricity instead of coal has greatly reduced the occurrence of industrial smog. However, the burning of fossil fuels like gasoline can create another atmospheric pollution problem known as photochemical smog. Photochemical smog is a condition that develops when primary pollutants (oxides of nitrogen and volatile organic compounds created from fossil fuel combustion) interact under the influence of sunlight to produce a mixture of hundreds of different and hazardous chemicals known as secondary pollutants. The Table below describes the major toxic constituents of photochemical smog and their effects on the environment. Development of photochemical smog is typically associated with specific climatic conditions and centers of high population density. Cities like Los Angeles, New York, Sydney, and Vancouver frequently suffer episodes of photochemical smog.


Major Chemical Pollutants in Photochemical Smog:
Sources and Environmental Effects

Toxic Chemical

Sources

Environmental Effects

Additional Notes

Nitrogen Oxides
(NO and NO
2)
– combustion of oil, coal, gas in both automobiles and industry
– bacterial action in soil
– forest fires
– volcanic action
– lightning
– decreased visibility due to yellowish color of NO2
– NO2 contributes to heart and lung problems
– NO2 can suppress plantgrowth
– decreased resistance to infection
– may encourage the spread of cancer
– all combustion processes account for only 5 % of NO2 in the atmosphere, most is formed from reactions involving NO
-concentrations likely to rise in the future
Volatile Organic Compounds (VOCs)
– evaporation of solvents
– evaporation of fuels
– incomplete combustion of fossil fuels
– naturally occurring compounds like terpenes from trees
– eye irritation
– respiratory irritation
– some are carcinogenic
– decreased visibility due to blue-brown haze
– the effects of VOCs are dependent on the type of chemical
– samples show over 600 different VOCs in atmosphere
– concentrations likely to continue to rise in future
Ozone (O3)
– formed from photolysis of NO2
– sometimes results from stratospheric ozone intrusions
– bronchial constriction
– coughing, wheezing
– respiratory irritation
– eye irritation
– decreased crop yields
– retards plant growth
– damages plastics
– breaks down rubber
– harsh odor
– concentrations of 0.1 parts per million can reduce photosynthesis by 50 %
– people with asthma and respiratory problems are influenced the most
– can only be formed during daylight hours
Peroxyacetyl Nitrates (PAN) – formed by the reaction of NO2 with VOCs (can be formed naturally in some environments)
– eye irritation
– high toxicity to plants
– respiratory irritation
– damaging to proteins
– was not detected until recognized in smog
– higher toxicity to plants than ozone


(b). Development of Photochemical Smog

Certain conditions are required for the formation of photochemical smog. These conditions include:

1. A source of nitrogen oxides and volatile organic compounds. High concentrations of these two substances are associated with industrialization and transportation. Industrialization and transportation create these pollutants through fossil fuel combustion.

2. The time of day is a very important factor in the amount of photochemical smog present.

  • Early morning traffic increases the emissions of both nitrogen oxides and VOCs as people drive to work.
  • Later in the morning, traffic dies down and the nitrogen oxides and volatile organic compounds begin to be react forming nitrogen dioxide, increasing its concentration.
  • As the sunlight becomes more intense later in the day, nitrogen dioxide is broken down and its by-products form increasing concentrations of ozone.
  • At the same time, some of the nitrogen dioxide can react with the volatile organic compounds to produce toxic chemicals such as PAN.
  • As the sun goes down, the production of ozone is halted. The ozone that remains in the atmosphere is then consumed by several different reactions.

3. Several meteorological factors can influence the formation of photochemical smog. These conditions include:

  • Precipitation can alleviate photochemical smog as the pollutants are washed out of the atmosphere with the rainfall.
  • Winds can blow photochemical smog away replacing it with fresh air. However, problems may arise in distant areas that receive the pollution.
  • Temperature inversions can enhance the severity of a photochemical smog episode. Normally, during the day the air near the surface is heated and as it warms it rises, carrying the pollutants with it to higher elevations. However, if a temperature inversion develops pollutants can be trapped near the Earth’s surface. Temperature inversions cause the reduction of atmospheric mixing and therefore reduce the vertical dispersion of pollutants. Inversions can last from a few days to several weeks.

4. Topography is another important factor influencing how severe a smog event can become. Communities situated in valleys are more susceptible to photochemical smog because hills and mountains surrounding them tend to reduce the air flow, allowing for pollutant concentrations to rise. In addition, valleys are sensitive to photochemical smog because relatively strong temperature inversions can frequently develop in these areas.

(c). Chemistry of Photochemical Smog

The previous section suggested that the development of photochemical smog is primarily determined by an abundance of nitrogen oxides and volatile organic compounds in the atmosphere and the presence of particular environmental conditions. To begin the chemical process of photochemical smog development the following conditions must occur:

  • Sunlight.
  • The production of oxides of nitrogen (NOx).
  • The production of volatile organic compounds (VOCs).
  • Temperatures greater than 18 degrees Celsius.

If the above criteria are met, several reactions will occur producing the toxic chemical constituents of photochemical smog. The following discussion outlines the processes required for the formation of two most dominant toxic components: ozone (O3) and peroxyacetyl nitrate (PAN). Note the symbol R represents ahydrocarbon (a molecule composed of carbon, hydrogen and other atoms) which is primarily created from volatile organic compounds.

Nitrogen dioxide can be formed by one of the following reactions. Notice that the nitrogen oxide (NO) acts to remove ozone (O3) from the atmosphere and this mechanism occurs naturally in an unpolluted atmosphere.

O3 + NO »»» NO2 + O2

NO + RO2 »»» NO2 + other products

Sunlight can break down nitrogen dioxide (NO2) back into nitrogen oxide (NO).

NO2 + sunlight »»» NO + O

The atomic oxygen (O) formed in the above reaction then reacts with one of the abundant oxygen molecules (which makes up 20.94 % of the atmosphere) producingozone (O3).

O + O2 »»» O3

Nitrogen dioxide (NO2) can also react with radicals produced from volatile organic compounds in a series of reactions to form toxic products such as peroxyacetyl nitrates (PAN).

NO2 + R »»» products such as PAN

It should be noted that ozone can be produced naturally in an unpolluted atmosphere. However, it is consumed by nitrogen oxide as illustrated in the first reaction. The introduction of volatile organic compounds results in an alternative pathway for the nitrogen oxide, still forming nitrogen dioxide but not consuming the ozone, and therefore ozone concentrations can be elevated to toxic levels.